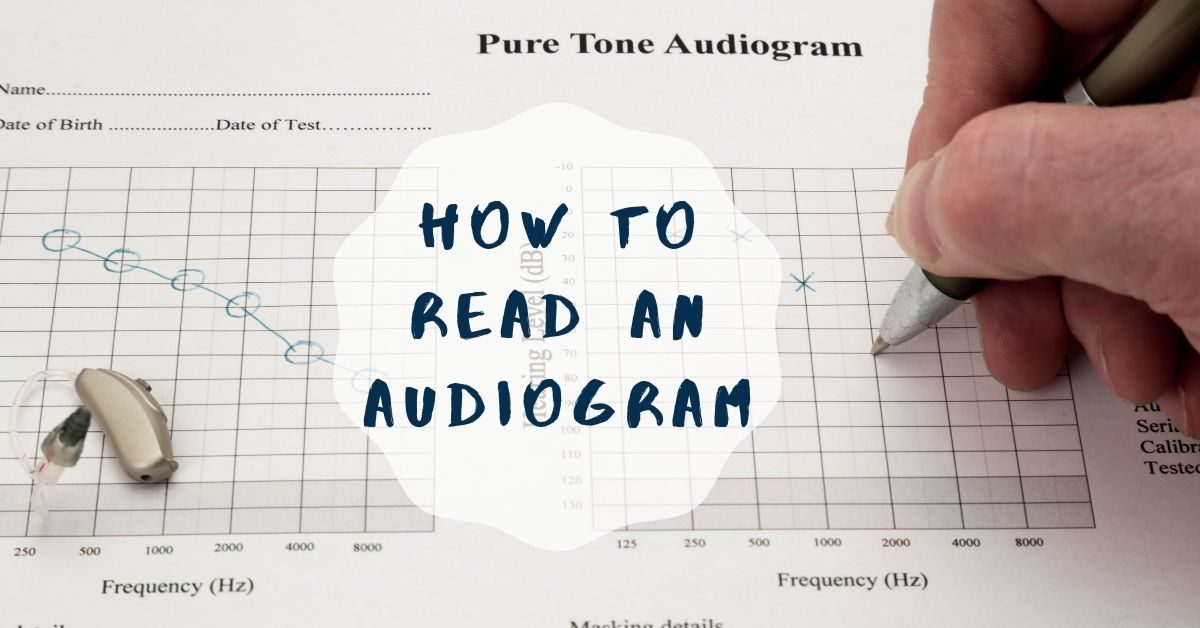
Hearing tests come in many shapes and forms. Some involve recognition of human speech or even bursts of air into the ears to test responsiveness. However, the most common form of hearing test is called “pure tone audiometry.” In this exam, a series of tones are played through headphones for the person taking the test. Every time one of these sounds is heard, the test taker is asked to gesture to the person administering the test, either with a button or simply by raising a hand. The test administrator records the ability of the test taker to hear sounds of different kinds and then reports back about hearing ability. Very simple!
Yet, such a simple test is enough to generate very thorough data about the qualities of hearing ability. After taking part in this simple test, your provider will generate a graph of your hearing ability, otherwise known as an audiogram. This document can be confusing to read, and it is not immediately apparent what it tells you about your hearing ability.
The good news is that even if you don’t fully understand how to read it, your hearing specialist is there to interpret the results for you and to make recommendations based on those findings. Let’s take a moment to understand how to read an audiogram.
Components of an Audiogram
If you are looking at an audiogram for the first time, it is important to recognize the different parts of the test. On the left side, the vertical axis, you will find a scale of decibels. Decibels are used to measure the loudness of a sound. For instance, a normal human conversation might be around 60 decibels, while a gunshot registers at about 140 decibels. This side of the audiogram is used to tell you how loud a sound must be in order for you to hear it. Those with hearing loss need a sound to be louder in order for it to register as being heard.
The scale of the vertical axis can be a little tricky to understand. At the very top tends to be the number -10 with 0 just below. At the bottom of that scale is 120. Let’s try to understand the meaning of these numbers. The 0 decibels indicator does not actually mean that there is no loudness at all. Instead this 0 level is used to designate the normal level of hearing, and the line is smoothed to indicate how a person with no hearing loss tends to hear. The number -10 at the top means that you are able to hear a sound that is 10 decibels quieter than the normal person. However, as you move downward on the scale, sounds are actually getting louder. For instance, if you need a sound to be 30 decibels higher than the normal person in order to hear it, then you would register the number 30.
Along the bottom or top of the audiogram, the horizontal axis, are numbers designating frequencies, or pitches, of sound. As we know, sounds range from the very low such as a motorcycle engine to the very high such as a mouse squeaking. The range of frequencies noted along the bottom or top of the audiogram usually ranges at least from 250 Hertz to 6000 Hertz, capturing the range of human speech. At several increments of pitch, or frequency, sounds are measured in the hearing test. If you are able to hear a low-frequency sound at only 10 decibels louder than the normal person, that point is given a circle or an X, designating the right ear or the left ear respectively. However, if a high-frequency sound needs to be 40 decibels higher than the normal person in order to be able to hear it, then the audiogram is telling you that you have more hearing loss in the high frequencies of sound than in the lower ones. The comparison of circles and Xs is used to tell if your hearing is symmetrical or asymmetrical between the two ears.
Pacific Hearing Care
Knowing how to read an audiogram can be helpful and interesting if you are curious about your hearing ability. However, our team at Pacific Hearing Care is trained to read and interpret the results for you, so don’t feel overwhelmed if you are struggling to understand it! Contact us today to schedule a hearing test and get on the path to better hearing. We look forward to hearing from you!

